2024 Electoral Census

What will turnout look like in 2024?
In the 2020 presidential election, we predicted a record-breaking turnout of 157.4 million, coming within 1 million votes of the final total. We expect turnout to come in slightly lower this year, at 153.7 million. While only a slight decline in raw numbers, population growth in the last four years means we’ll see a 4 percentage point drop in the Voting Eligible Population (VEP) turnout rate, from 66.6 percent in 2020 to 62.5 percent in 2024.
This election will feature a series of demographic firsts: the first time Hispanics outnumber Black voters in a presidential election, by 11.0 to 10.9 percent, and the first presidential election in which the number of voters with bachelor’s degrees will cast more than 4 in 10 votes, at 41.6 percent.
For the first time, we’re also showing you localized estimates of demographics and turnout down to the census tract level and how these numbers might change if turnout is slightly higher or lower than we expect. A basic description of the methodology we used to come up with these numbers can be found with our 2020 estimates.
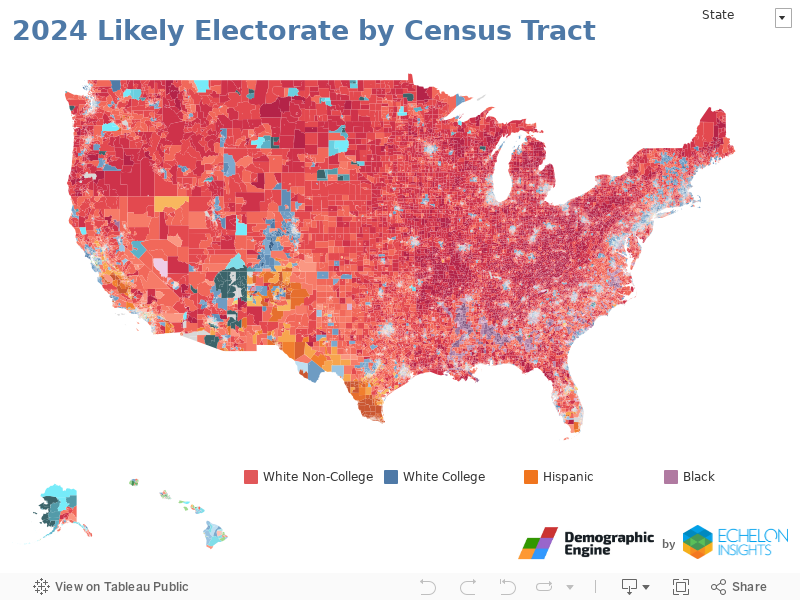
What does my community look like?
Search for your community by entering a city, county, or ZIP code in the search box, or filter by state. If you ever need to get back to the current national or statewide view, just click the home button ![]() .
.
State-by-state estimates
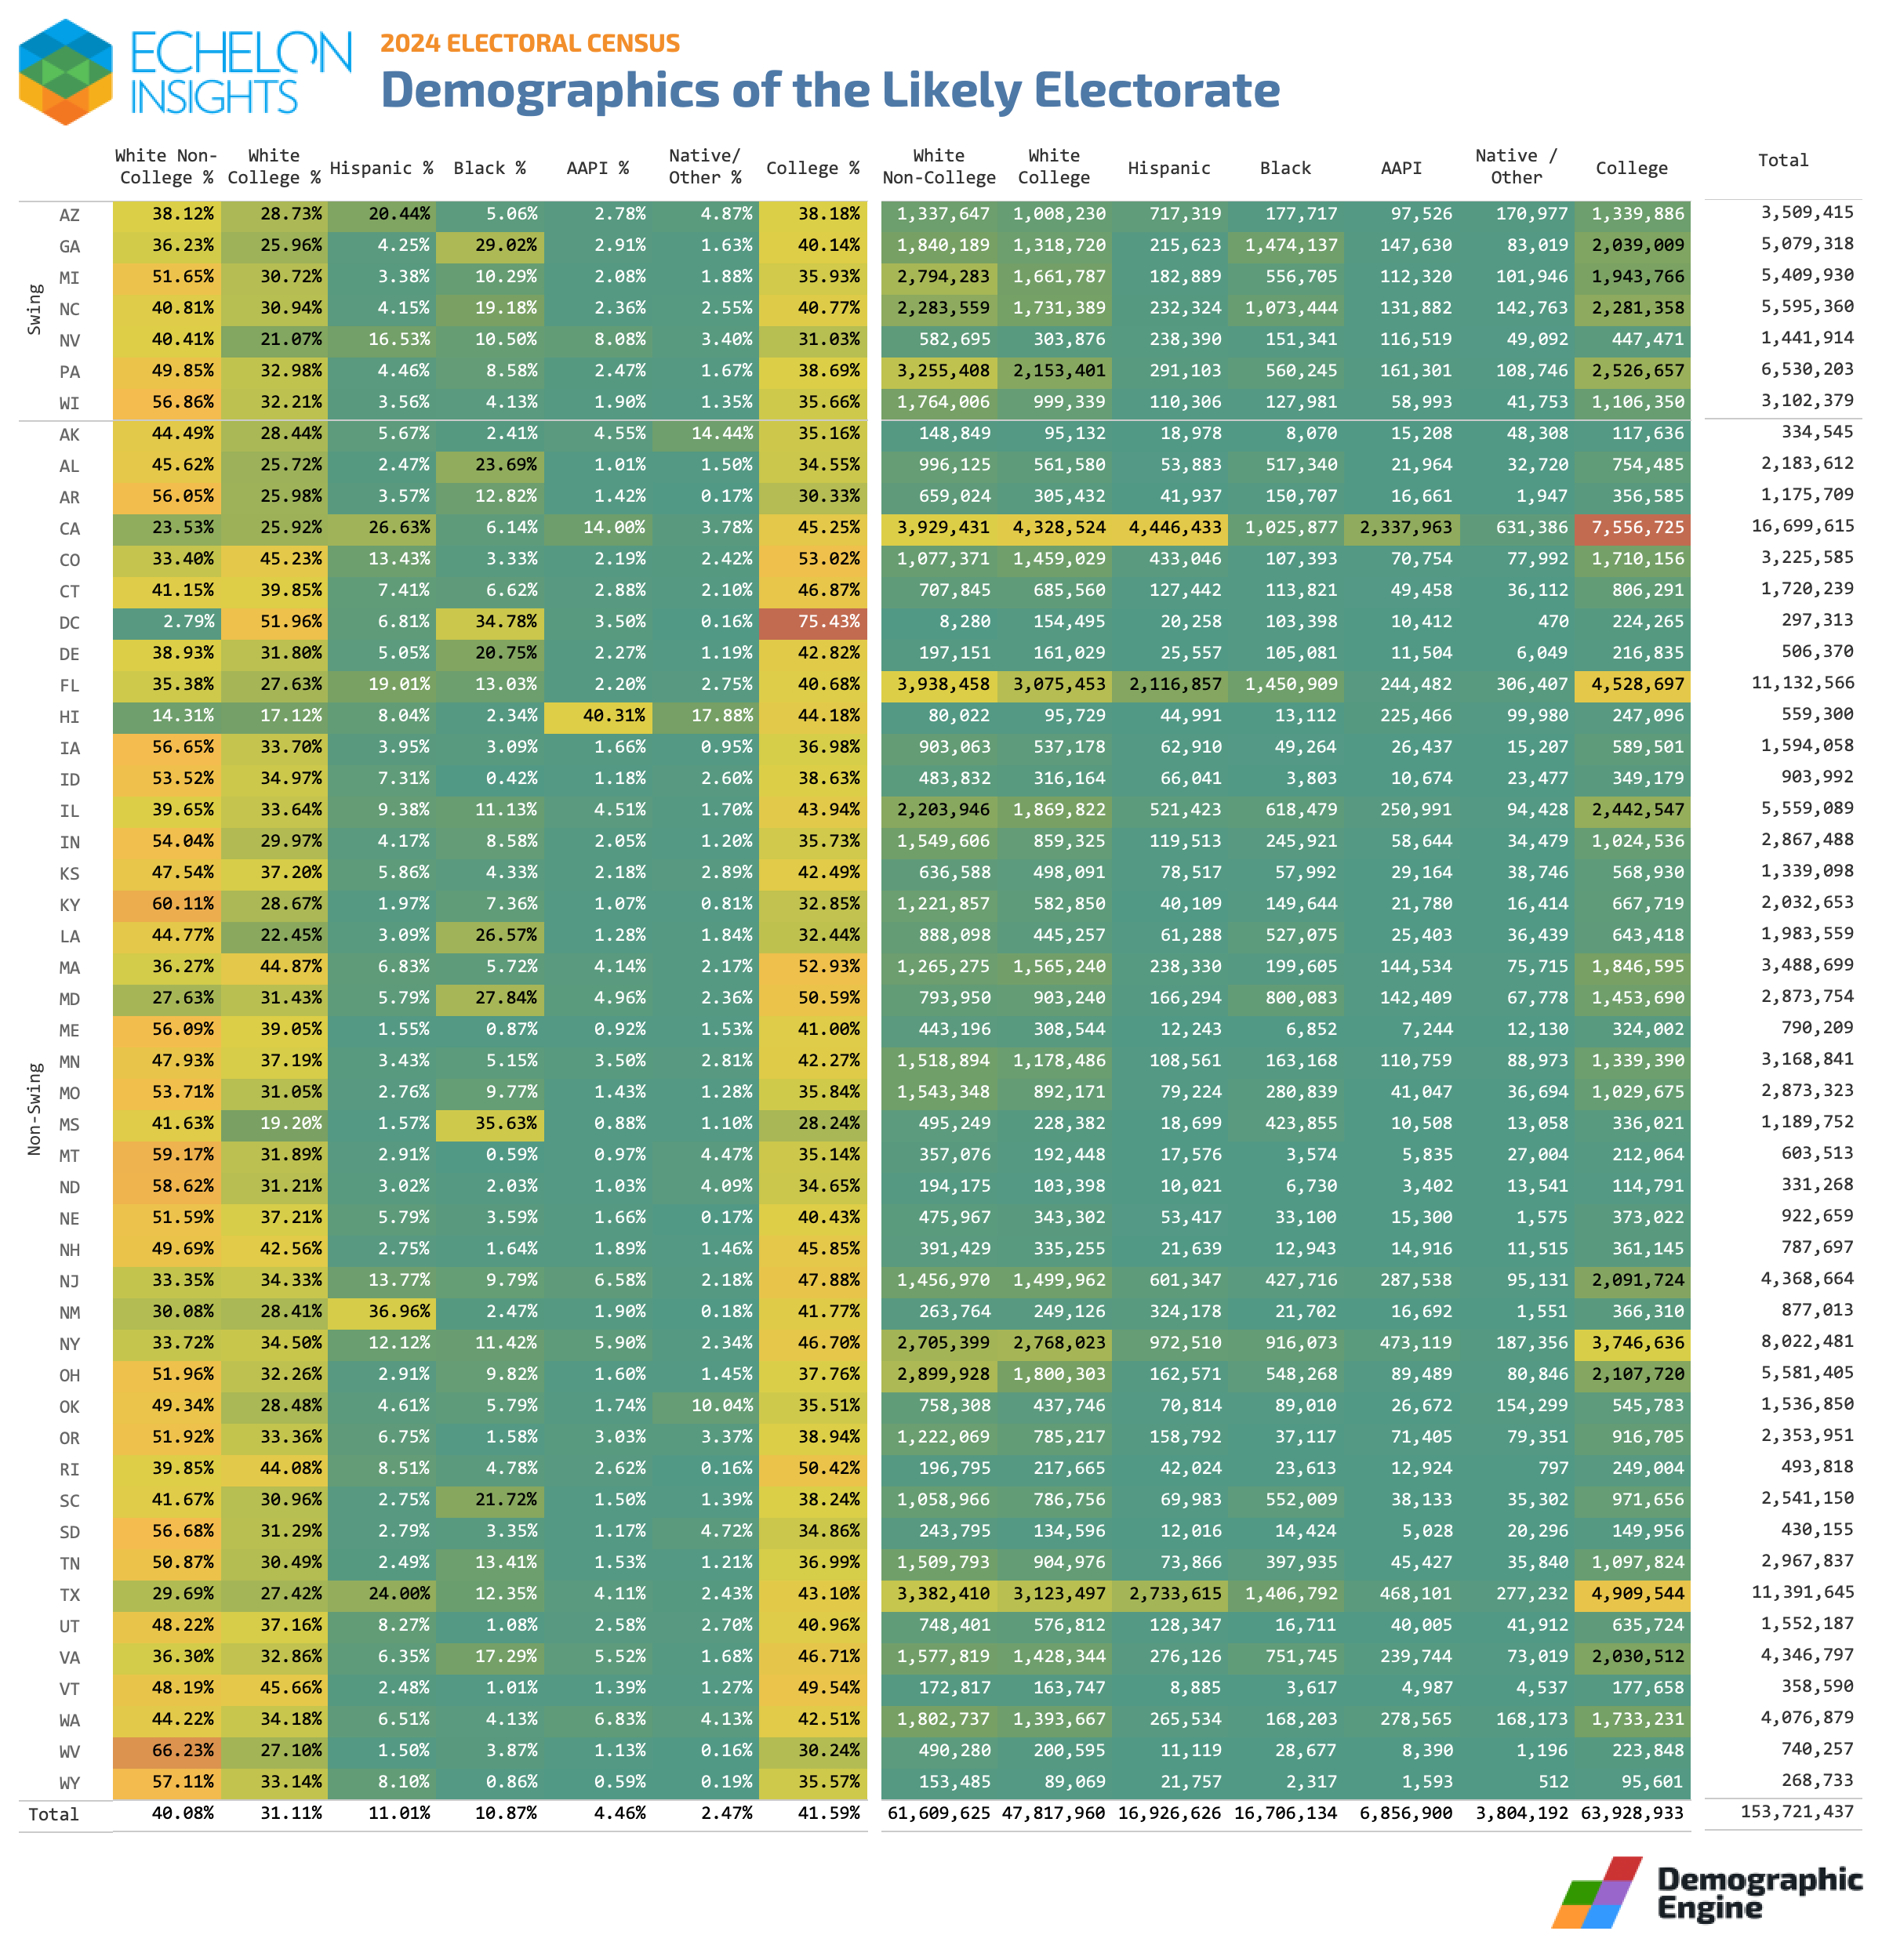
Download Full Size Image
What happens if turnout is higher or lower?
One of the biggest questions in politics right now is whether or not higher turnout now benefits Republicans. While it’s likely that the presumed Democratic advantage has eroded, there are still reasons to think that many of the lowest-propensity voters still lean Democratic, specifically young voters and minorities.
Below, you’ll see how our demographic estimates change as turnout goes higher or lower. We also show you what we think the marginal voter looks like as you go from, say, 151 million in turnout to 153 million. The topline numbers don’t change that much due to the law of large numbers, but you’ll see how the marginal voter at risk of not turning out looks very different. They’re much more nonwhite, Hispanic especially, and have a lot fewer whites with degrees. White non-college voters are not over-represented among these voters relative to the country as a whole.

What about partisanship directly? We can look at this at the voter file itself, looking at known partisan preferences: party registration in states that have it and past voting in Democratic or Republican primaries. With the caveat that party registration lags behind changes in party ID, our baseline expectation is that registered or primary-voting Democrats will outpace known Republicans by 1.3 points, ranging from 0.9 points in the lowest turnout scenario to 1.6 points in the highest scenario.
The marginal voter, however, leans Democratic by 6.7 points, with this advantage increasing slightly as you go up the turnout curve. That’s because the lowest propensity voters aren’t whites without a college degree, who tend to be older, but younger and nonwhite. Still, a lot depends on the underlying preferences of these different groups of voters: a majority of voters on the bubble have no partisan history at all, 54%, compared to 41% overall. While there’s evidence that the lowest propensity minority voters may now be more Republican than those who reliably turn out, on the margin, any net new voters from this group would still favor Democrats, albeit by less than among high-propensity voters.
One important is that this assumes a neutral turnout environment, with rising enthusiasm affecting all groups in the electorate based on well-established turnout patterns. It doesn’t account for enthusiasm being higher among one party over the other due to factors specific to this election cycle. Because is built on historical turnout data, this would require making an assumption tantamount to a guess about which candidate will win, which we obviously don’t know yet.

The most enduring pattern in voter turnout is that older voters turn out more than younger voters, and in low-turnout environments, older voters make up a higher share of the electorate. Also, as the Baby Boom has aged into the 65+ category, the number of older voters in the electorate has been on the rise, while younger voters have been on the decline due to lower birth rates in recent decades.
In every election what is often described as “young voter enthusiasm” is actually just high turnout. In any higher turnout environment, young voters will turn out more, because older voters are close to being maxed out and there are more available nonvoters among the young. On the margin, there’s a dramatic difference between the voter at risk of not turning out: 33 percent are 18-34 and 58 percent are under 50 compared to 20 percent and 43 percent respectively for the electorate as a whole.

