Middle America Project 2022
Ranking America's Most Typical Counties
Swing Counties. Bellwethers. Tipping Points.
Ever since the saying, “Will it play in Peoria?” pollsters and marketers have sought after the one elusive “test market” that could help them divine which products and candidates would succeed or fail when they went national.
In 2018, we introduced the Middle America Project to answer just this question. We hoped to find the New Peorias, using data to answer which counties were most representative of the country as a whole. We merged data on election, income, education, race, religion, and more to score each county on how representative it is of the United States as a whole. Today, we’re updating the Middle America Project to reflect the most recent Census data and the results of the 2020 Census and the 2020 Presidential election.
2022’s Most Representative County: Lehigh County, Pennsylvania, U.S.A.

Albertus L. Meyers Bridge, Allentown, Pennsylvania.
Lehigh County, home of Allentown, is the county statistically closest to representing the United States as a whole. The Lehigh Valley is known for its rich history of manufacturing — Allentown as the home of Mack Trucks and nearby Bethlehem for its impressive and now abandoned Bethlehem Steel plant. Lehigh County sits in a cluster of Pennsylvania counties that scores exceptionally high in the Middle America Project rankings. Lehigh County ranked #2 in 2018 and unseats Dauphin County, home of the state capital of Harrisburg, as the #1 most representative county in the United States.
 Lehigh County voted for Joe Biden by 7.6 points in 2020, close to his national victory margin of 4.5 points. Its median household income of $65,667 closely matches the national median of $68,799. On all measures except the percent of adults who identify as Evangelical, Lehigh County ranks within 600 places (out of more than 3,000 counties) of the national average.
Rounding out the top 5 are 2) Scott County (Davenport), Iowa, 3), Rice County (Faribault), Minnesota, 4) New Haven County, Connecticut, and 5) Clay County (Kansas City suburbs), Missouri.
The Middle America Top 25

Mapping Every County
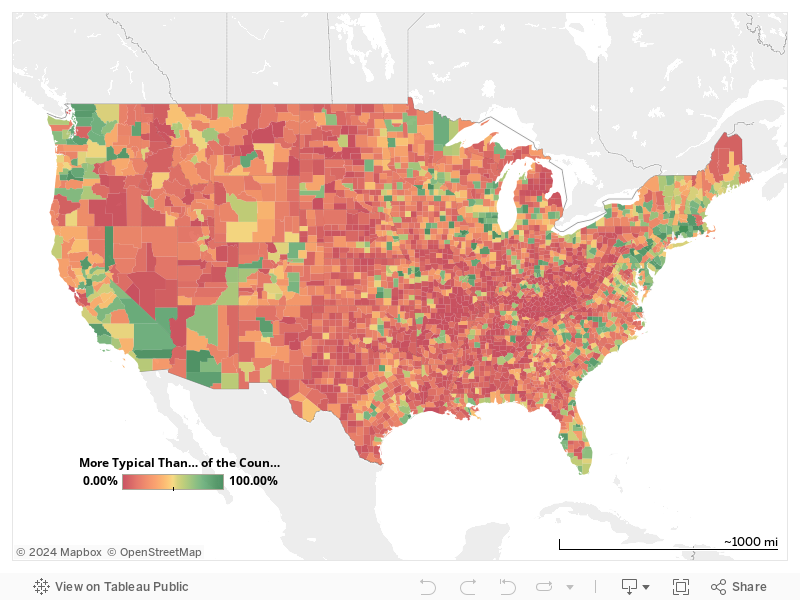
“Middle America” conjures up images of the rolling farmlands of the Midwest. But many of the most “typical” counties in America are on the coasts, with high scoring counties throughout New England, in the New York City metropolitan region, Florida, and California. The reason why is that they have a lot of suburbs. At the midpoint between big cities and rural areas, suburbs and small cities tend to score highest on the Middle America Project, and there are plenty of those along the coasts. Election results are just one part of the scoring; counties are also evaluated on whether they match the national averages on diversity, education, income, and religiosity. Nevertheless, three of the top five counties in the Middle America Project are in the Midwest.
The Boomerang Pattern Formed by America’s Most Typical Counties
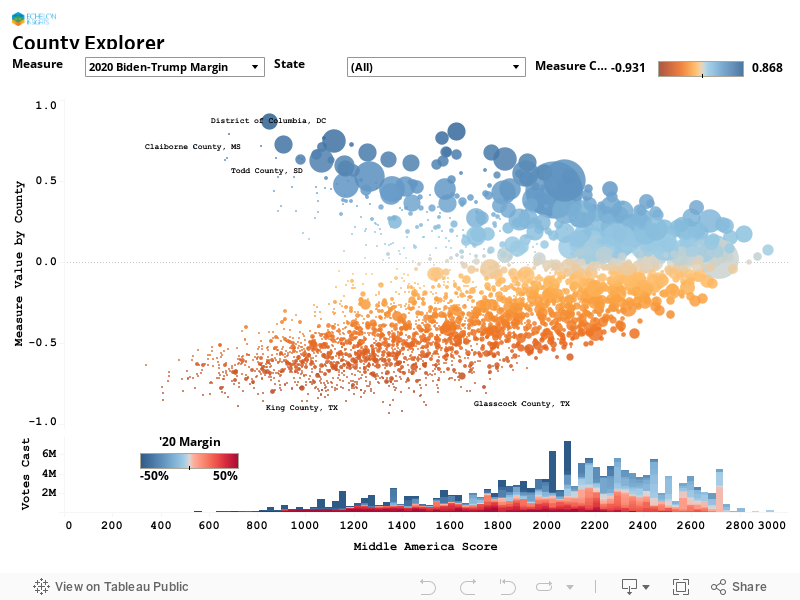
Because our Middle America Score tries to measure the most statistically average counties in America, plotting our scores against its various components yields a boomerang with the two “wings” of above-average and below-average counties spreading out from our high-ranking counties. The Middle America Score consists of more than a dozen measures, with some weighted more highly, specifically the 2020 election results and college graduation rate (which often tend to be a proxy for income, population density, and diversity). You can explore each county and how the various counties in our index interact with the Middle America Score below. The more significant the factor, the more the interactive below resembles a boomerang.
Counties Closest to the U.S. Midpoint in Every State

Key Regions in Focus
D.C., New York, Boston

Chicago

California

Why This Matters
Reporters, feature writers, and demographers will continue to study out archetypes and places that stand out. Because so many of them live and work in highly educated metropolitan areas that are not representative of America as a whole, there is a natural curiosity in trying to understand something that’s the opposite of their day-to-day existence. But there is also value in immersing oneself in places that have it all, mixing red and blue in close proximity. We’ve often seen election year stories about electoral “bellwethers” – the counties that consistently pick the winners in Presidential politics – but over the years, stale heuristics have grown up accompanying battleground state coverage and they failed to account for the titanic shift in political geography we saw in 2016. Many old bellwethers, like the suburbs of major cities, are no longer close because their social and demographic makeup has diverged dramatically from the country as a whole. The Middle America Project is our attempt to update these assumptions for a new era. When it comes to finding 2020’s swing voters or test markets for new products, the Middle America Project shows you the map.
Sources: Echelon Insights’ Demographic Engine, U.S. Census American Community Survey 5-Year Estimates and 2020 Decennial Census; Election Results from Dave Leip’s Atlas of U.S. Presidential Elections; U.S. Religion Census. County-level analysis excludes Alaska which does not report election results by county-level units.
America in Focus
When the New York Times needed a partner for their public-facing focus groups, they chose Echelon Insights. We help you pierce institutional bubbles by starting conversations with voters representing a true cross-section of America. Learn more about our focus group work and schedule your next focus group in Middle America today.

The Intersection
Get the best stories in polling, data, and technology delivered to you weekly